Ultimate Desmos Guide forSAT Math
Master the Desmos calculator to solve 90% of SAT math problems with our comprehensive guide
Master Desmos for SAT Math Success!
This comprehensive guide teaches you how to solve 90% of SAT math problems using Desmos alone. Learn essential techniques for solving equations, systems of equations, and generating equations from points. Perfect for SAT prep and test day strategies.
Introduction
Welcome to the Ultimate Desmos Guide, and thank you for choosing SATMaxxing for your prep! Desmos is one of the most powerful tools available to boost your SAT score and save valuable time. You can solve approximately 90% of SAT math problems using Desmos alone. This guide will walk you through how to tackle a wide variety of problem types using primarily Desmos.
If you're on a desktop, click the Desmos logo on the right side of the screen to open a window with the calculator you'll have access to on test day.
Solving Equations
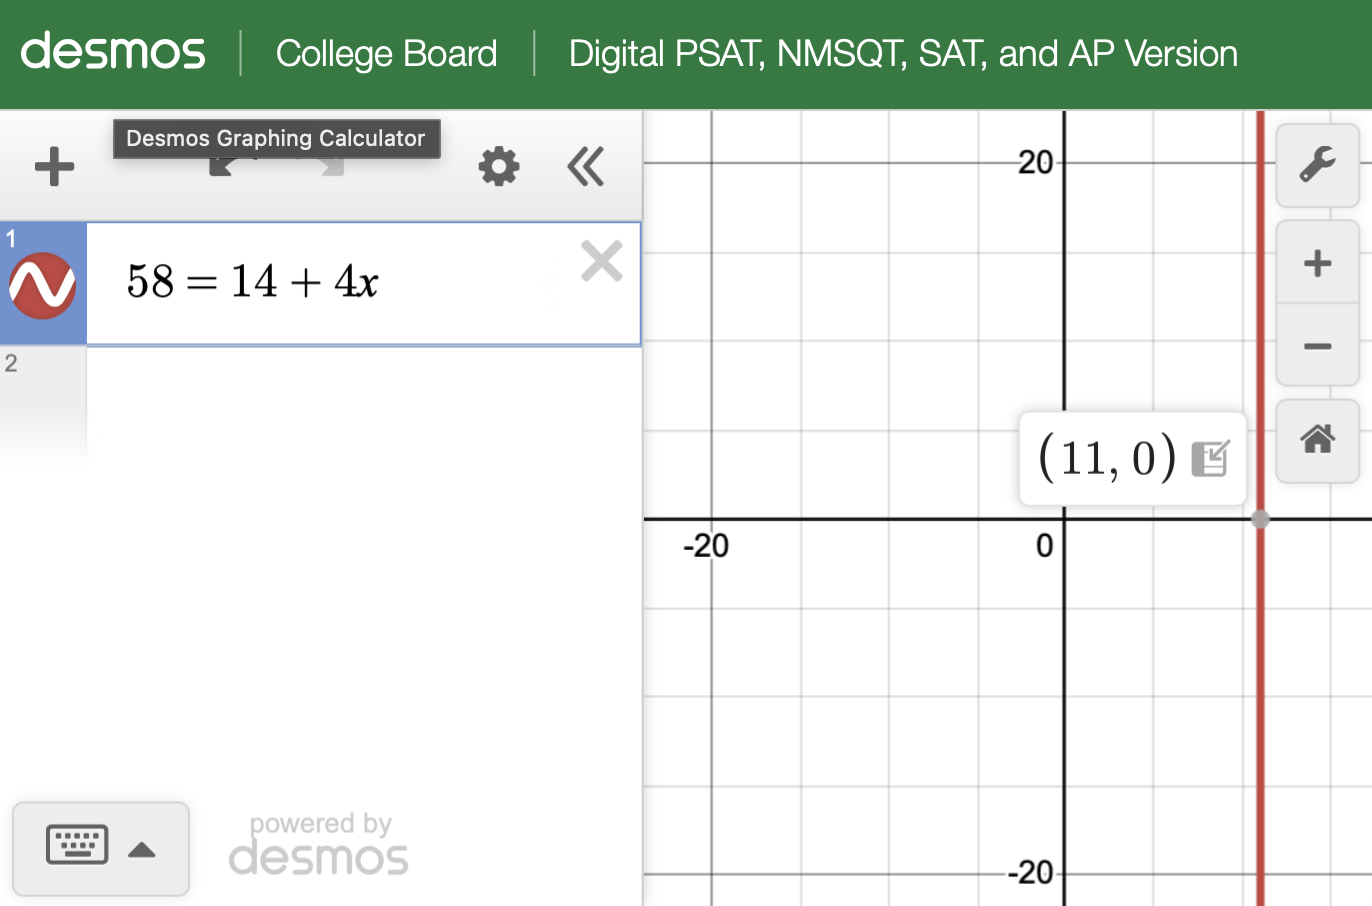
Desmos can be used to solve any equation of the form f(x) = g(x). You can enter the equation directly to view the graphical solution, or use regression. Let's look at the example below.

Enter 58 = 14 + 4x into Desmos. The solution will appear on the graph.
You can also use Desmos' built-in regression feature. In this context, regression can solve equations for you.
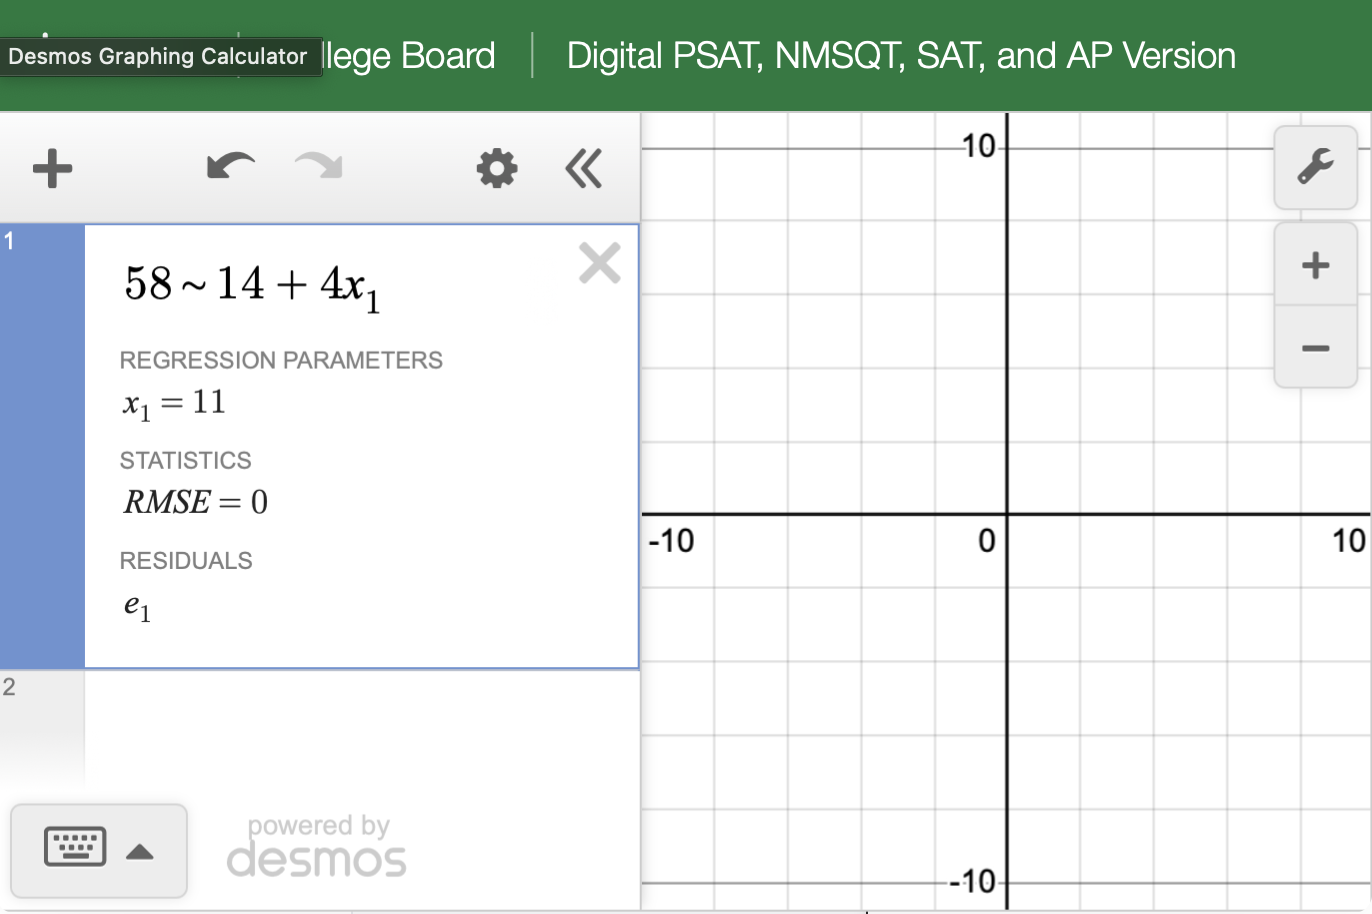
When using regression in Desmos, make sure to use a tilde (~) instead of an equals sign. Also write x₁ instead of x, and y₁ instead of y. If you don't use this syntax, regression will not work.
⚠️ Regression is very important, so remember the syntax. You will see it again later. ⚠️
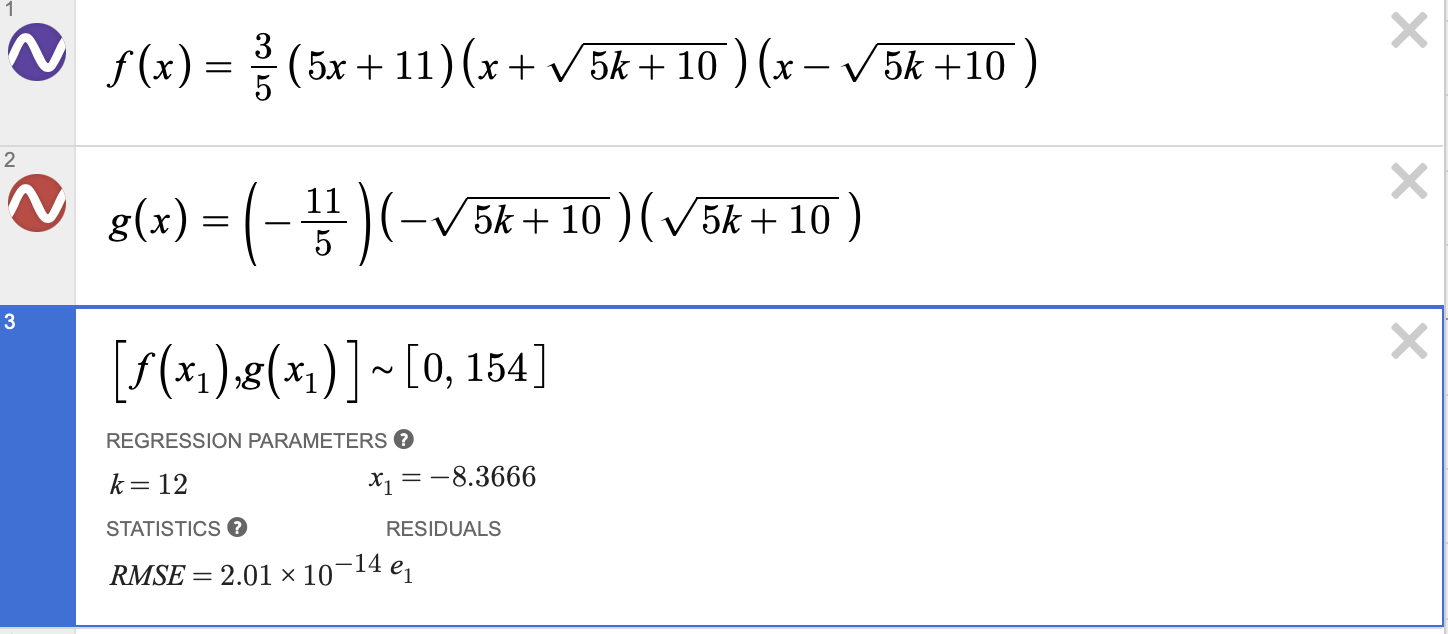
This example is straightforward and may make regression seem unnecessary, but it becomes very useful for more complex equations. Here's a tougher example:
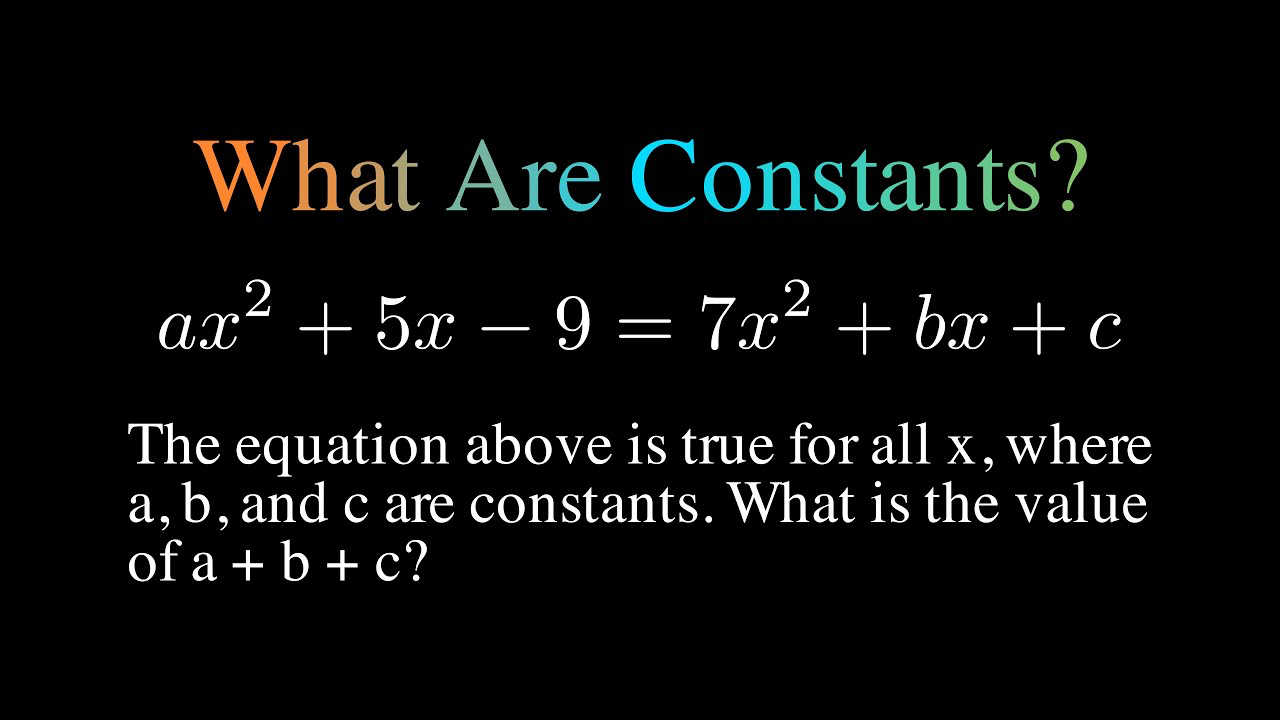
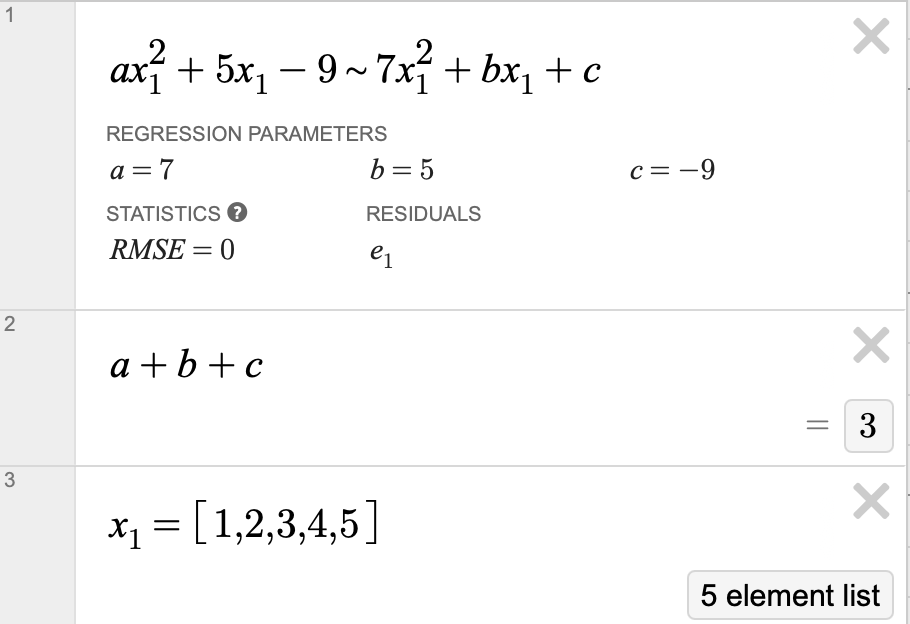
In this case, you must define x₁ as a list of numbers (I recommend 5 or higher) to signal that it's a variable. If you don't do this, you'll get the wrong result.
Generating Equations From Points
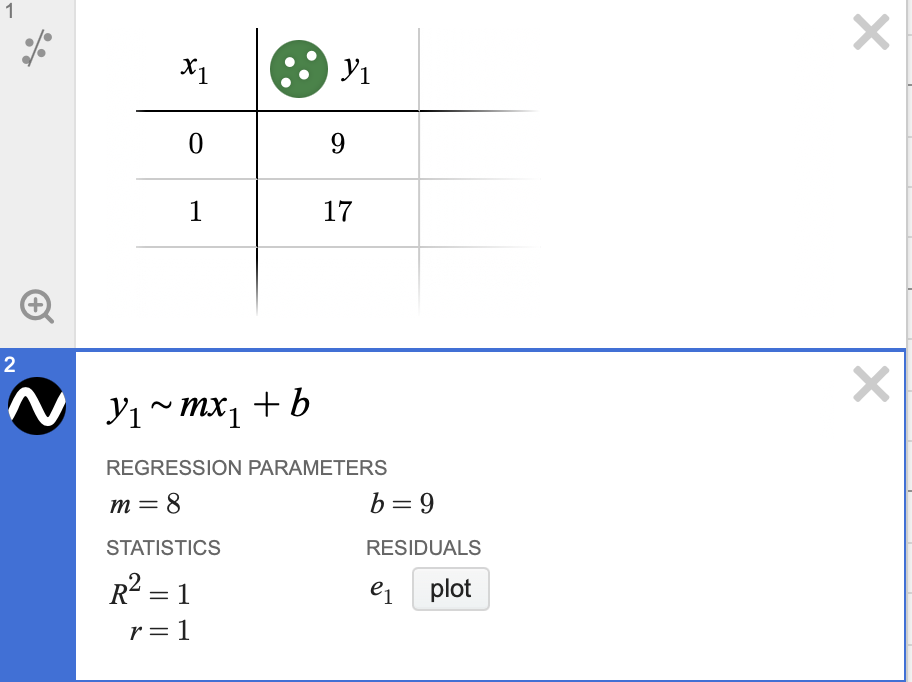
Regression in Desmos can also generate equations from given points.
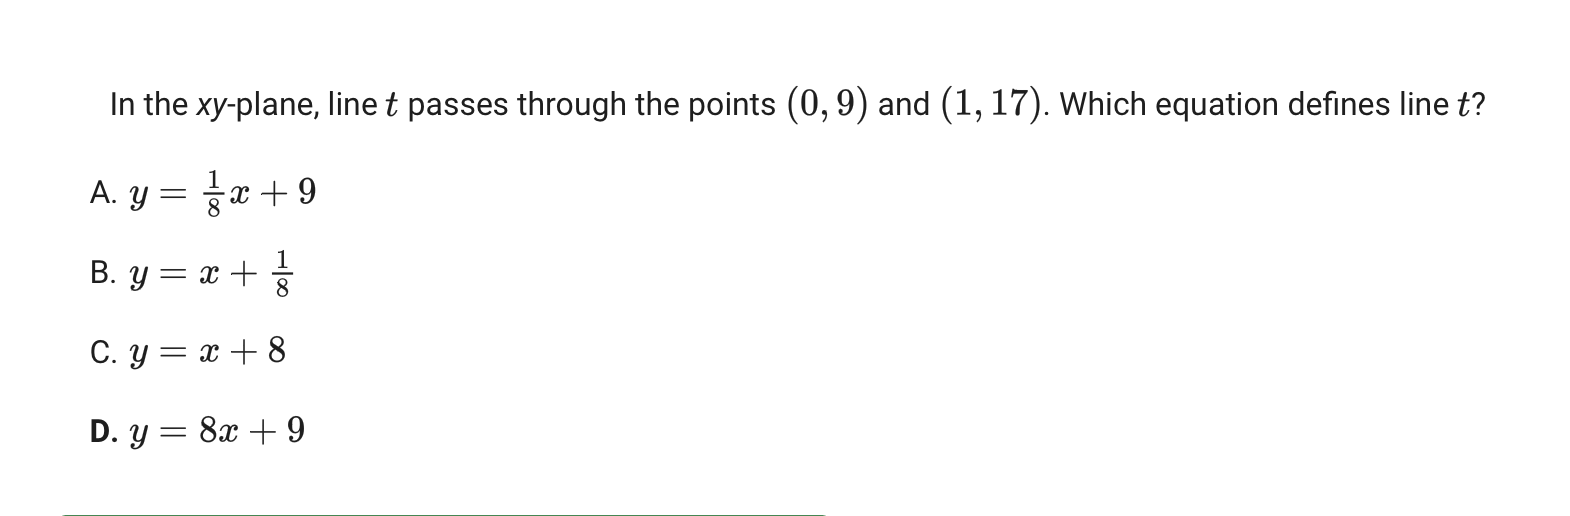
Click the plus sign in the top left corner and select "Table." Enter the points (0, 9) and (1, 17). Then enter y₁ ~ mx₁ + b into Desmos. It will calculate the values of m and b automatically.
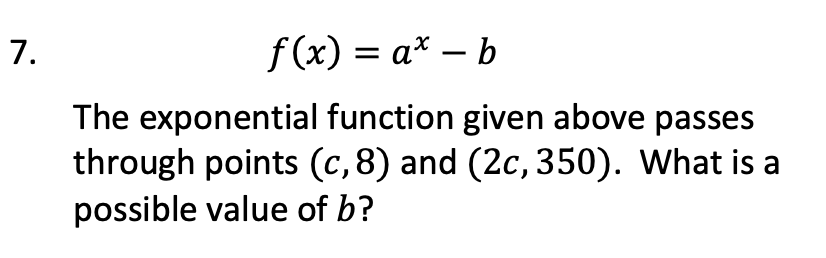
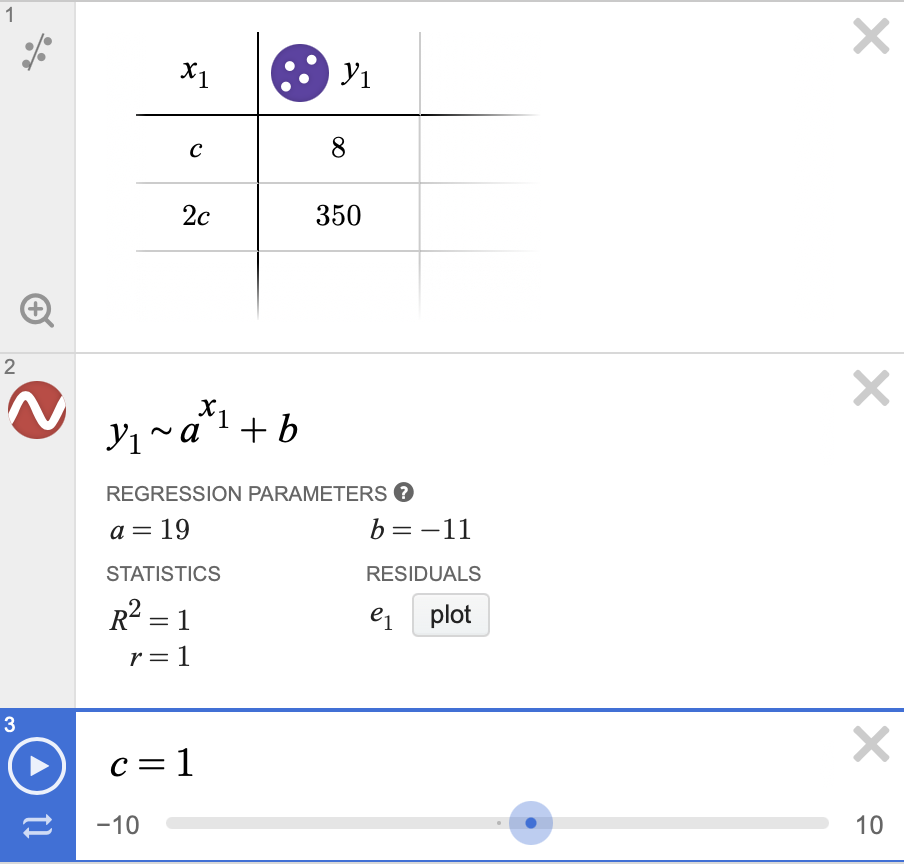
This method works with all types of equations, not just linear. Here's another example:
Systems of Equations
Desmos can also be used to solve systems of equations.
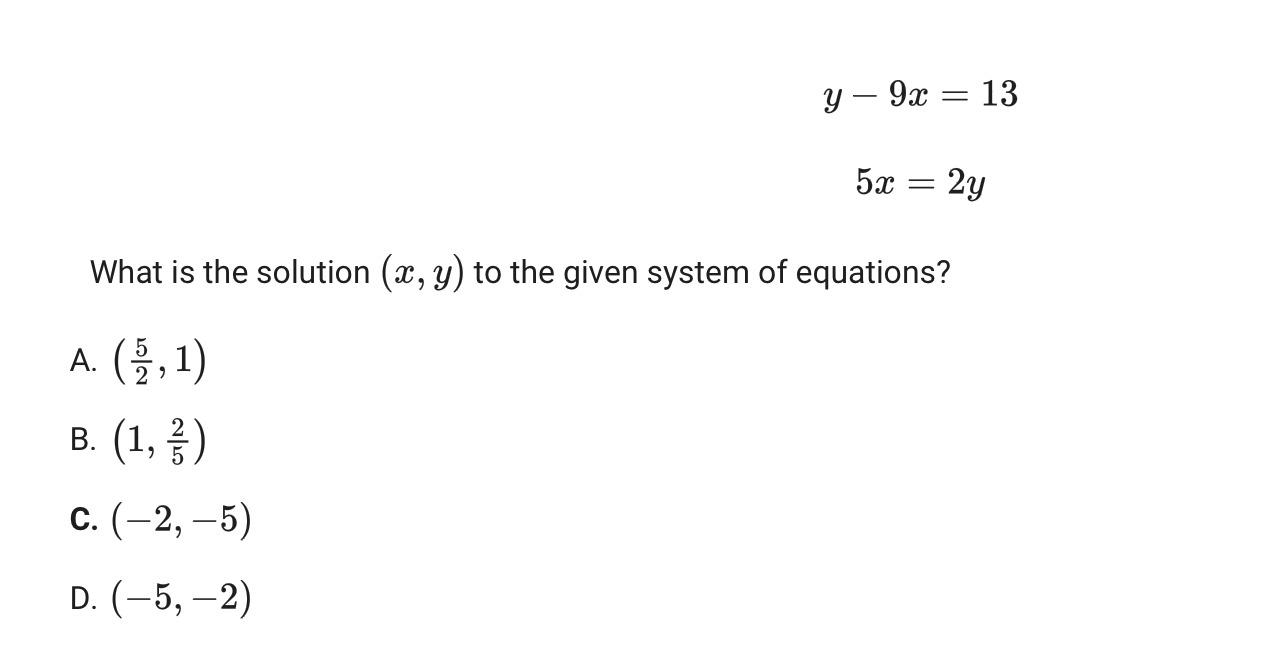
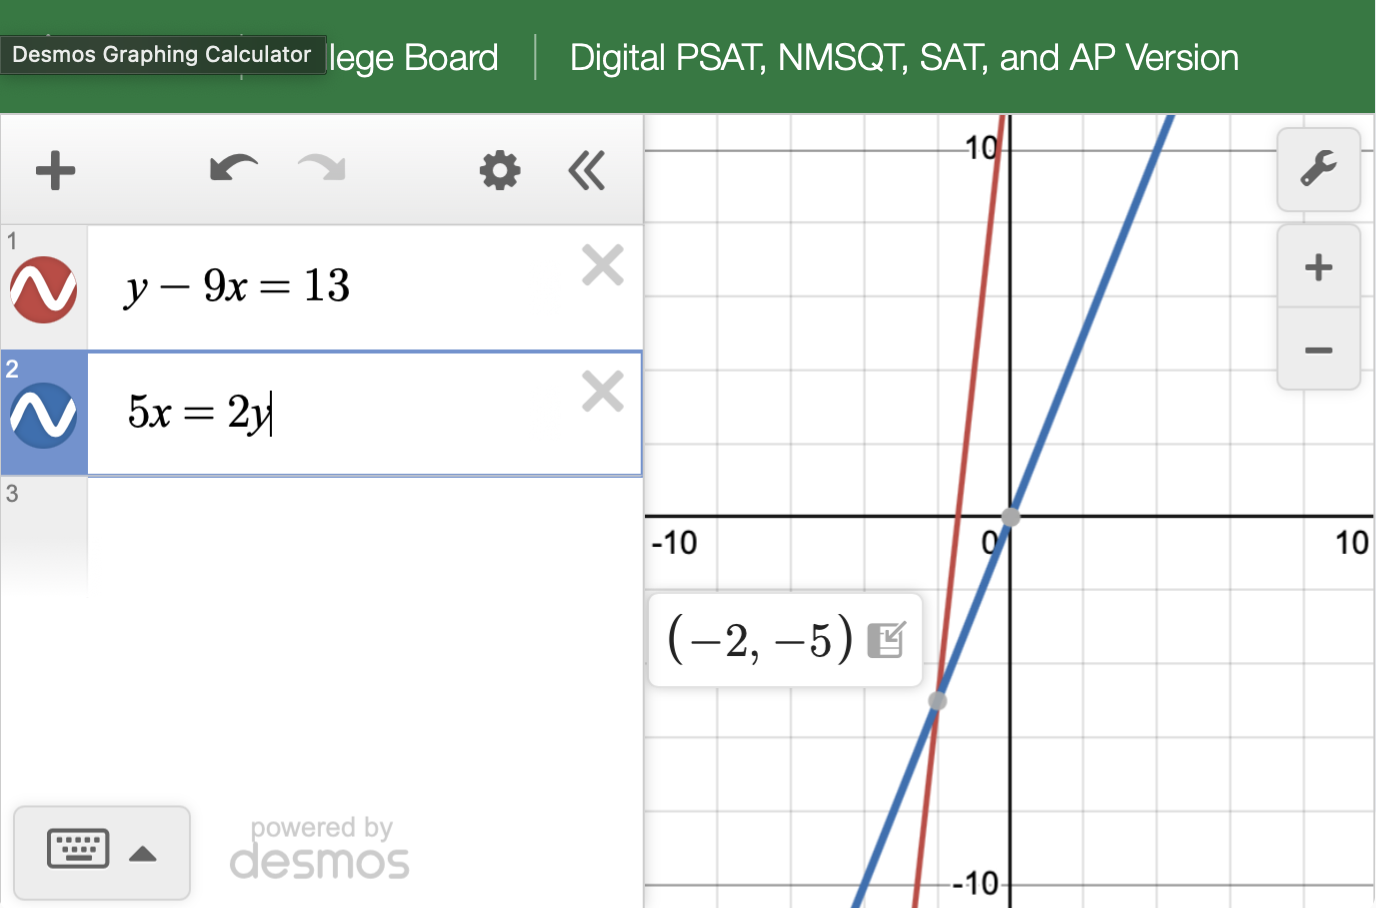
Method 1: Graphing
Graph each equation and find their intersection point. The intersection is the solution. In the example below, it is (-2, -5).
Method 2: Regression
You can also solve systems using regression.
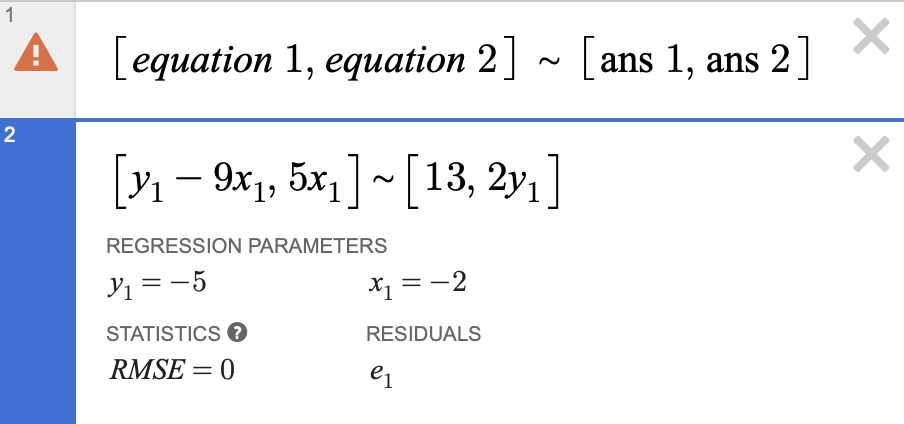
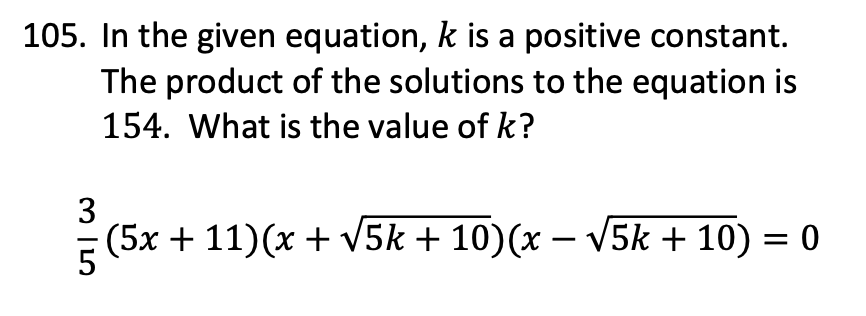
The format shown in the first cell allows you to solve many types of problems. Here's a more complex system solved using regression:
Conclusion
Mastering Desmos can significantly boost your SAT math performance. The three key techniques in this guide are solving equations, generating equations from points, and solving systems of equations. These strategies will help you solve most SAT math problems quickly and accurately.
Remember the regression syntax: use a tilde (~) instead of an equals sign, write x₁ instead of x, and y₁ instead of y. For complex equations, define your variables as lists so Desmos treats them as variables, not constants.
Practice these techniques with a range of problems. Desmos will help you save time and avoid mistakes on test day. The graphical approach gives you both answers and insight into the math behind them.
Good luck with your SAT preparation. With Desmos in your toolkit, you are ready to handle even the most difficult problems.
Frequently Asked Questions
Can I use Desmos on the actual SAT test?▼
What types of SAT math problems can I solve with Desmos?▼
How do I remember the regression syntax for Desmos?▼
Join the waitlist or head back to our landing page to see how we make SAT prep actually enjoyable.
Back to Landing